Requirements for monitoring
In an environment with multiple docker hosts and a bunch of containers there are new requirements regarding monitoring the infrastructure. In addition to non-containerized environments where hosts or virtual machines and applications are monitored you want to get some information about your running containers like:
- Number of running or stopped containers in your environment
- Memory, CPU, IO load per container or per service
- Distribution of your containers or services over you hosts
- Access to meta data of your containers like version, image name, etc.
- more?
Environment
Some Code samples an explanations are specific for our environment, which uses the following tools:
- Rancher as container orchestration plattform
- Docker hosts running on AWS managed by rancher
- T,I and C of the influxdata TICK stack.
- Grafana for visualizing data replacing the Chronograph part of the TICK stack
Configure and roll out Telegraf
Assuming that Rancher, some docker hosts, an InfluxDB and Grafana is already in place and setup, we can start configuring telegraf and rolling it out on our docker hosts. Telegraf is responsible for collecting real time data.
Create an adjusted telegraf container
First create a docker file for telegraf
# telegraf docker file
FROM debian:jessie
MAINTAINER Markus Wehrle <markus.wehrle@haufe-lexware.com>

ENV DEBIAN_FRONTEND noninteractive
ENV TELEGRAF_VERSION 1.1.1

RUN gpg \
    --keyserver hkp://ha.pool.sks-keyservers.net:80 \
    --keyserver-options http-proxy=http://10.12.1.236:8083 \
    --recv-keys 05CE15085FC09D18E99EFB22684A14CF2582E0C5

RUN apt-get update \
    && apt-get install -y wget \
    && wget -q https://dl.influxdata.com/telegraf/releases/telegraf_${TELEGRAF_VERSION}_amd64.deb.asc \
    && wget -q https://dl.influxdata.com/telegraf/releases/telegraf_${TELEGRAF_VERSION}_amd64.deb \
    && gpg --batch --verify telegraf_${TELEGRAF_VERSION}_amd64.deb.asc telegraf_${TELEGRAF_VERSION}_amd64.deb \
    && dpkg -i telegraf_${TELEGRAF_VERSION}_amd64.deb \
    && rm -f telegraf_${TELEGRAF_VERSION}_amd64.deb*

ADD scripts/start_telegraf.sh /

RUN chmod +x /start_telegraf.sh

COPY conf/telegraf.conf /etc/telegraf/telegraf.conf

ENTRYPOINT ["/start_telegraf.sh"]
In the entry point script we fetch the name of our host from the rancher metadata service and pass it as an environment variable to telegraf
#!/bin/bash

# get the host name for submit in monitoring
# set the env variable that is used in the telegraf config file
export INFLUX_TELEGRAF_HOST=$(curl "http://rancher-metadata/2015-07-25/self/host/hostname")
exec telegraf
The default config file of telegraf requires the following changes
agent section
[agent]
  ## Override default hostname, if empty use os.Hostname()
  hostname = "$INFLUX_TELEGRAF_HOST"
output section
[[outputs.influxdb]]
  ## The full HTTP or UDP endpoint URL for your InfluxDB instance.
  ## Multiple urls can be specified as part of the same cluster,
  ## this means that only ONE of the urls will be written to each interval.
  # urls = ["udp://localhost:8089"] # UDP endpoint example
  urls = ["$INFLUXDB_HOST"] # required
  ## The target database for metrics (telegraf will create it if not exists).
  database = "$INFLUXDB_NAME" # required

  ## Retention policy to write to. Empty string writes to the default rp.
  retention_policy = ""
  ## Write consistency (clusters only), can be: "any", "one", "quorum", "all"
  write_consistency = "any"

  ## Write timeout (for the InfluxDB client), formatted as a string.
  ## If not provided, will default to 5s. 0s means no timeout (not recommended).
  timeout = "5s"
  username = "$INFLUXDB_USER"
  password = "$INFLUXDB_PASSWORD"
inputs section
The inputs.docker section must be activated and should look like
# # Read metrics about docker containers
 [[inputs.docker]]
   ## Docker Endpoint
   ##   To use TCP, set endpoint = "tcp://[ip]:[port]"
   ##   To use environment variables (ie, docker-machine), set endpoint = "ENV"
   endpoint = "unix:///var/run/docker.sock"
   ## Only collect metrics for these containers, collect all if empty
   container_names = []
   ## Timeout for docker list, info, and stats commands
   timeout = "5s"

   ## Whether to report for each container per-device blkio (8:0, 8:1...) and
   ## network (eth0, eth1, ...) stats or not
   perdevice = true
   ## Whether to report for each container total blkio and network stats or not
   total = false
Roll it out on every docker host
Once your telegraf container is build and ready to deploy, you need to run it on every docker host in your environment.
This is sample compose file:
version: '2'
services:
  telegraf:
    environment:
      INFLUXDB_HOST: <influxdb_host>
      INFLUXDB_NAME: <influxdb_name>
      INFLUXDB_USER: <influx_user_with_write_access>
      INFLUXDB_PASSWORD: <influx_password>
      HOST_MOUNT_PREFIX: /hostfs
      HOST_ETC: /hostfs/etc
    image: <name_of_your_telegraf_image>
    stdin_open: true
    tty: true
    labels:
      io.rancher.container.pull_image: always
      io.rancher.scheduler.global: 'true'
    volumes:
    - /var/run/docker.sock:/var/run/docker.sock:ro
    - /sys:/rootfs/sys:ro
    - /proc:/rootfs/proc:ro
    - /etc:/rootfs/etc:ro
    - /:/hostfs:ro
    stdin_open: true
    mem_limit: 16777216
Replace the parameters to fit your environment. The rancher specific labels make sure, that the telegraf container is running on every host. If you add additional host to the rancher environment, a telegraf container will be started on the newly added host and you will receive data of the new host instantly.
Create some nice dashboards
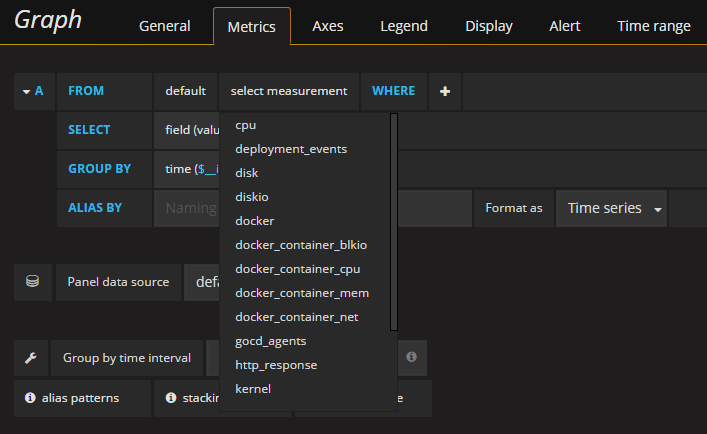
Now! Open grafana and add some panels to visualize your data. A lot of new measurements should be available in the query editor of grafana. Measurements from containers starting with docker_ and basic metrics from the hosts themselves like cpu, disk, etc..
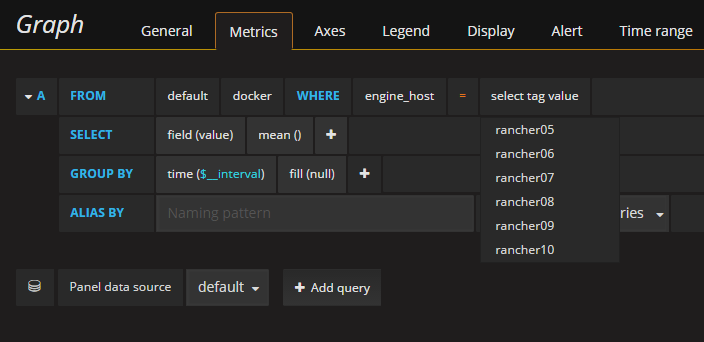
All your hosts should be available as filter with the names you gave them in rancher. In our case rancher05 to rancher10.
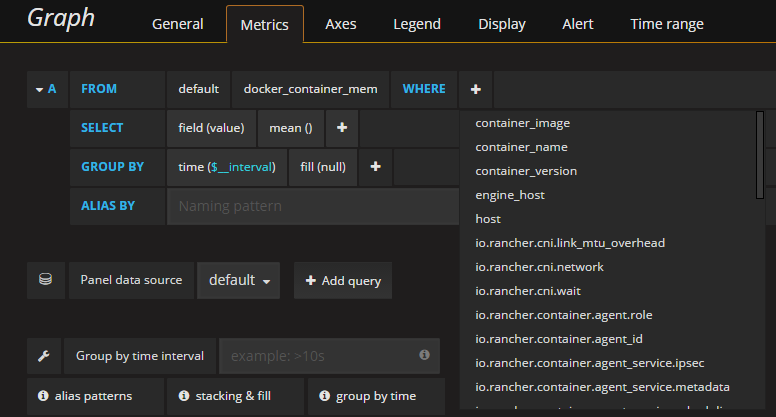
As well as environments, stacks and services you defined in rancher or container image names including version and other custom meta data.
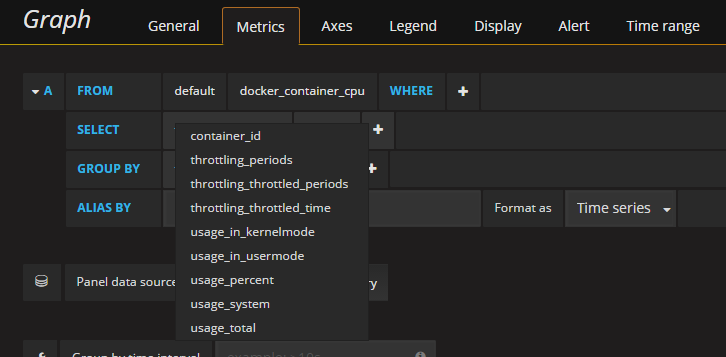
Combined with one of the field values, you can drill down to a single container measurement if required.
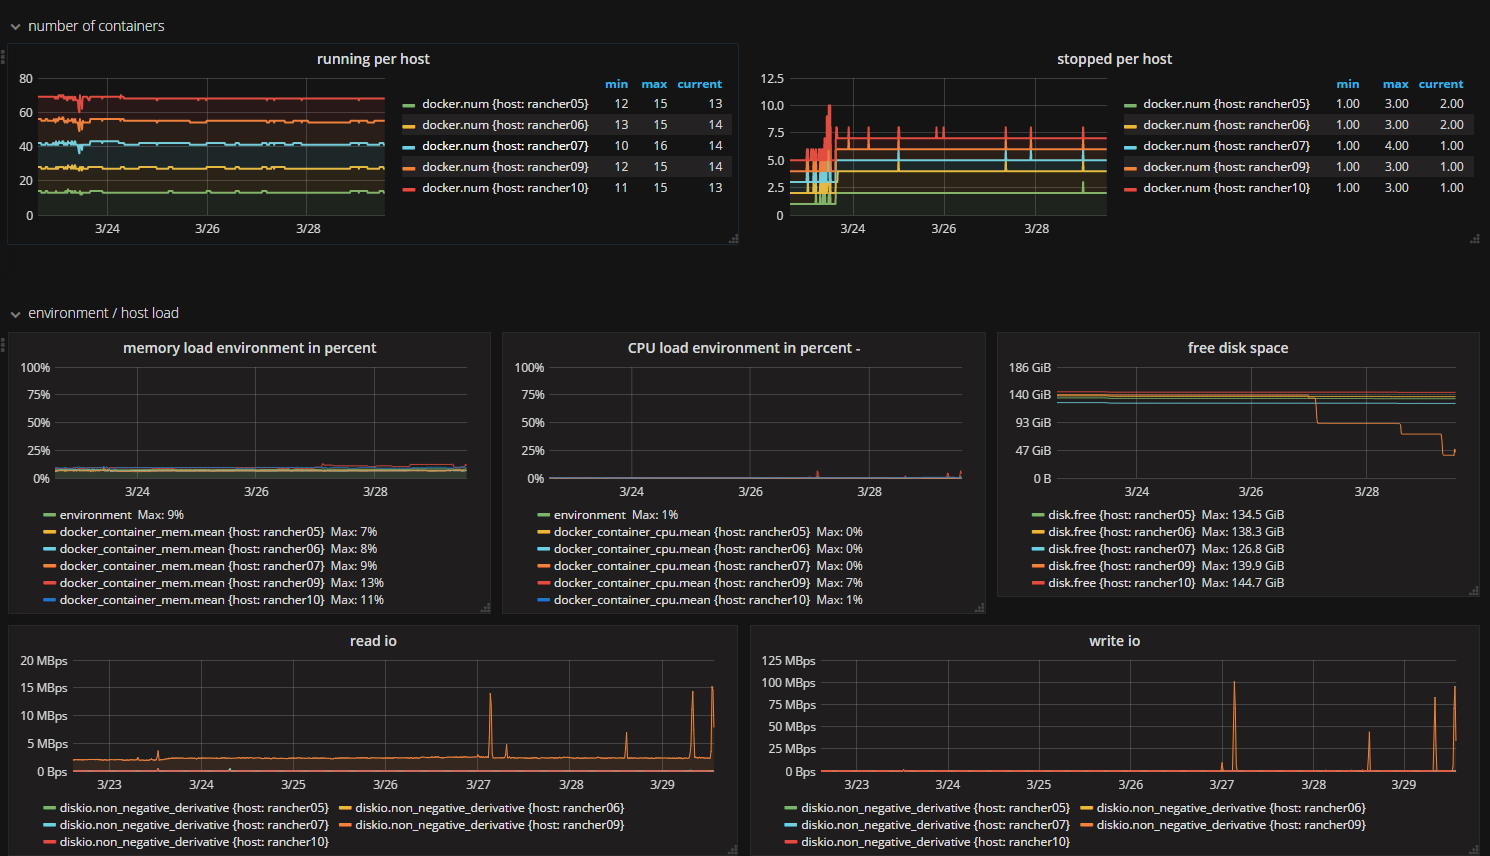
Sample dashboard
This is one of our dashboards create using data collected with the configuration described above.
Automatically add new hosts
In a docker environment hosts are added or removed over time. You can add an additional query for each new host to be shown on the dashboard by cloning a previous one. This would make a lot of work to keep your dashboards up to date over time. But a simple GROUP BY “host” in the query will do this work for you.
SELECT last("n_containers_running") as num FROM "autogen"."docker" WHERE $timeFilter GROUP BY "host", time($interval) fill(null)
New hosts will be displayed in graph and legend automatically, while old are removed, if there is no data of them to display. Historical data is kept and old hosts are shown when you scroll back in time.